17 Observability
Status: draft M0. Normative for telemetry (traces, metrics, logs), privacy of the telemetry, collector, dashboards, SLOs, alerts, in-app statistics and the boundary to the audit log. This chapter summarizes the rules; the details are under docs/observability/. Terms: 00-glossary.md. Operations: 16-operations.md.
1. Goals
- An instance operator sees within minutes whether messages arrive, whether agents run and whether push works, and follows a request from the app to the agent runtime.
- Telemetry reveals no content and is not suitable for monitoring individual people.
- Telemetry never blocks the message path.
- The backend is replaceable: a switch is configuration, not code.
2. Basic rules
| No. | Rule | Source |
|---|---|---|
| 1 | Instrumentation only with OpenTelemetry (Go SDK in the server, OTel SDKs in Python and TypeScript in the adapters). | B11 |
| 2 | Export only to an OpenTelemetry Collector. No process talks directly to a vendor backend. | B11, ADR 0034 |
| 3 | No message content, prompts, file names, search terms, tokens or secrets in telemetry. Enforcement at the source and in the collector (allowlist). | B11, privacy.md |
| 4 | Telemetry is asynchronous with a bounded queue. If it is full, the process drops data and counts bothy.telemetry.dropped. An export error never changes the result of a request. If a processor of the SDK drops data without feedback, the README of platform/otel names this uncounted point. |
R-Telemetrie |
| 5 | gen_ai.* attributes are only in one package per codebase (server, SDK). Their status is "Development"; a change of the convention is a change at exactly this place. |
R-Telemetrie, signals.md 6 |
| 6 | The audit log is not telemetry: its own table, the same transaction, never sampled, never via the collector. | B11, audit-vs-telemetry.md |
| 7 | The in-app statistics read their own tables, never the telemetry backend. | admin-statistics.md |
| 8 | People appear in telemetry only as a pseudonym (HMAC with telemetry.pseudonym_key_ref). Metrics never carry person attributes. |
privacy.md |
| 9 | Every attribute of a metric has a finite set of values bounded by the instance operator. IDs are only in spans and logs. | signals.md 2 |

3. Signals
The catalogue in signals.md is the only list of all names, units and attributes. Summary:
| Area | Core signals |
|---|---|
| REST | http.server.request.duration (semantic conventions, stable) |
| Sync | bothy.delivery.duration, bothy.gateway.connect.duration, bothy.gateway.catchup.duration, bothy.event.fanout.lag, bothy.db.event_seq.lock_wait |
| Agents | bothy.run.start.latency, bothy.run.duration, bothy.run.finished, bothy.run.steps, bothy.run.tokens, bothy.run.cost, bothy.agent.consumer.lag |
| Push | bothy.push.sent, bothy.push.skipped, bothy.push.fetch |
| Database | Receiver postgresql in the collector, db.client.operation.duration, bothy.db.pool.connections |
| Backup | bothy.backup.last_success.timestamp, bothy.backup.restore_test.*, bothy.storage.volume.* |
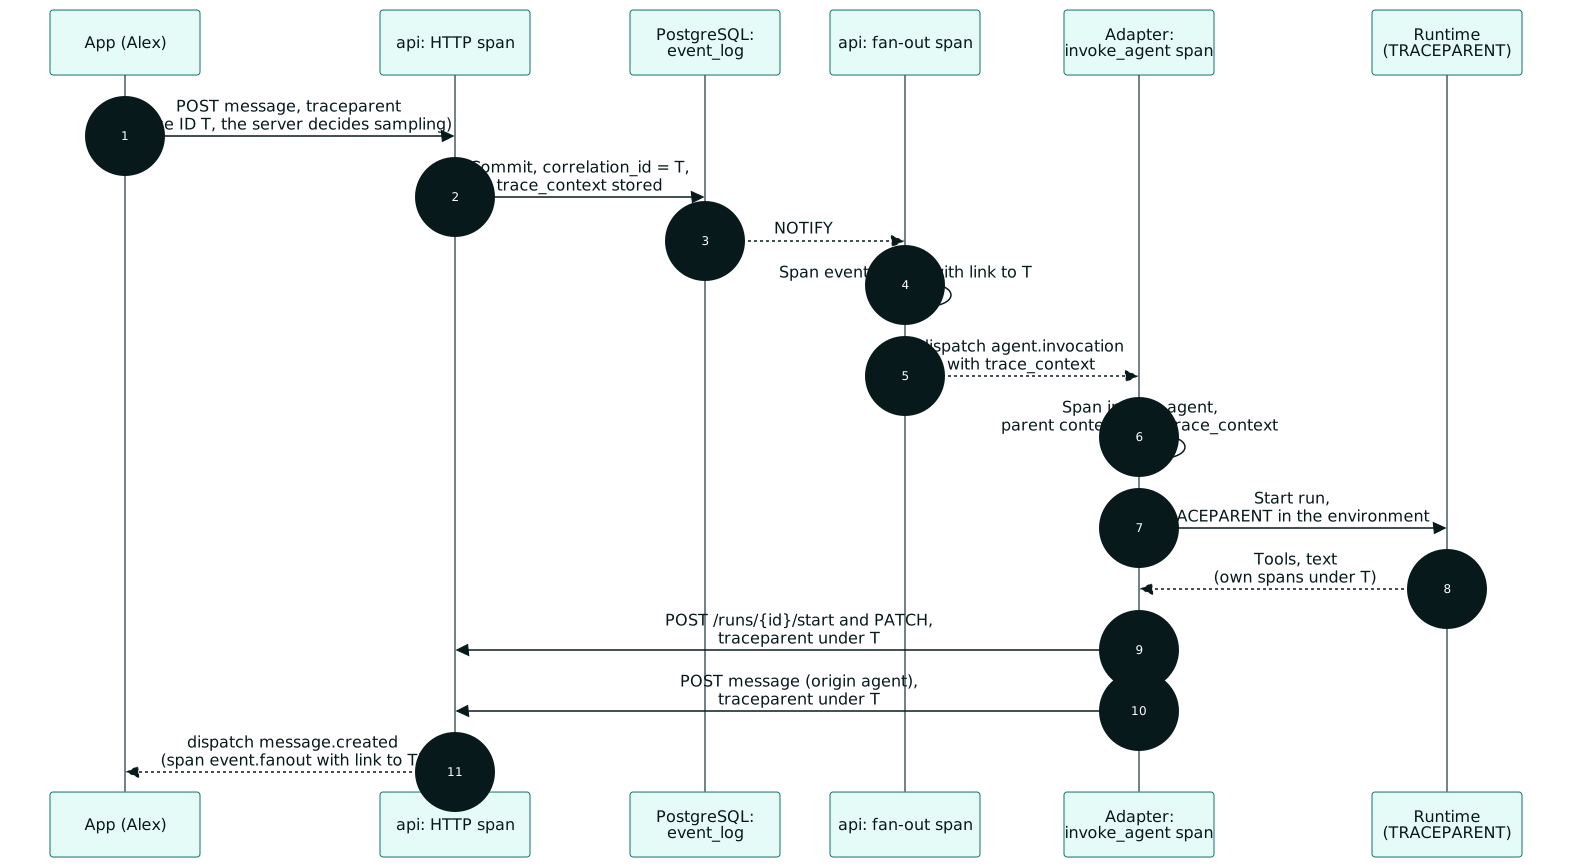
Traces follow a request via W3C Trace Context: app, REST, event log, fan-out, adapter,
runtime. At the public listener, the server starts its own trace and links an
incoming traceparent as a span link; it becomes the parent context only with
telemetry.traces.trust_remote_parent. correlation_id in events and audit is the trace ID
of the triggering request; every request has one, even with telemetry.enabled = false.
For passing it on to adapters, the envelope carries the field trace_context (W3C traceparent,
stored in event_log.trace_context; 03, 04 section 2.2).
4. Privacy
- Prohibition at the source: instrumentation sets only attributes from the catalogue.
- Second line in the collector:
transform/scrubdeletes known content fields, the allowlist (redaction) removes every other key and replaces values that look like a token or an email address with HMAC-SHA-256. - Check: a canary test sends content with a secret word through the real path and searches for the word in all exported data. A hit breaks the gate.
- Retention in the local stack:
BOTHY_PROMETHEUS_RETENTION,BOTHY_LOKI_RETENTION,BOTHY_TEMPO_RETENTION(Compose variables). With external backends, the contract with the provider applies; the owner enters it into the record of processing activities (chapter 20).
Details: privacy.md.
5. Collector and backends
The base infra/otel/collector.yaml receives, filters and
distributes. Overlays under infra/otel/exporters/ attach backends: local (Prometheus, Loki,
Tempo), newrelic, grafana, datadog, azure-monitor, sentry, none. Two overlays can
be combined. Details: collector.md,
backends.md.
6. SLOs and alerts
| SLO | SLI | Target | Alert |
|---|---|---|---|
bothy-api/requests-availability |
REST without 5xx | see file | Page and ticket |
bothy-sync/delivery-latency |
Live delivery within the threshold | see file | Page and ticket |
bothy-sync/reconnect |
Upgrade to ready within the threshold |
see file | Page and ticket |
bothy-push/provider-acceptance |
Acceptance by the provider | see file | Page and ticket |
bothy-agents/run-start |
queued to running within the threshold |
see file | Page and ticket |
bothy-agents/turn-duration |
completed runs within the threshold | see file | ticket only |
Targets and thresholds are only in the Sloth files under infra/observability/slo/; the
table in slos.md reproduces them, and a check keeps both equal.
Burn-rate alerts with the multi-window method (start values 14.4, 6 and 1; Sloth adds 3).
Alerts go to an alert channel of the instance and, for page, additionally to an external
channel; a watchdog reports a dead alert path. Details: slos.md,
alerting.md.
7. Dashboards
Six Grafana dashboards as files under infra/observability/grafana/dashboards/, loaded
via file provisioning: server, delivery and sync, agent runs, push, database and
backup, SLO overview. With M7, a seventh dashboard bothy-live with the project's own
panel plugin is added (25-visualization.md, section 8). Details:
dashboards.md.
8. In-app statistics
The admin console shows usage per space, runs, tool calls, costs and error rates from
its own tables. Counters about people appear only from privacy.stats_min_group_size on (20-privacy.md); values per person
do not exist. Details: admin-statistics.md.
8.1 Own SLI measurement
For live views and the SLO traffic light of the apps, the server measures by itself (25-visualization.md, section 3; ruling T7):
- Every measuring point of an SLI (section 6) reports its value twice: to the OTel instrument and
via
kernel/measureto the modulestats. The own measurement countscountandgoodper minute into the tablestats_minutes(03, section 4.15); it never reads from the telemetry (rule 7, R-OB-08 stays). - The boundary for "good" and the target come from the same Sloth files as the Prometheus rules; a generator produces them for server and app, a check keeps them equal (25, section 3.3). The boundary is a bucket boundary of the histograms (R-OB-06), so both paths count the same events as good.
- The traffic light is called "own measurement" and does not raise alerts. Alerts still come from
Prometheus (section 6). Deviations are possible: errors before the server (proxy) are missing
from the own measurement, and a crash loses at most one
stats.flush_interval. - Like the telemetry, the own measurement never blocks the message path (rule 4): counters in
memory, writing in the background, loss counted in
bothy.stats.flush.dropped.
8.2 Visualizations
The views of the apps and of the console (live topology, backend view, delivery and sync live,
executive page, daily timeline, TV mode) and the Grafana panel plugin bothy-live-panel are
governed by 25-visualization.md. The plugin reads only metrics and traces
of this chapter; the views of the apps read only the project's own statistics API.
9. Apps
- There is no official OpenTelemetry SDK for Dart
(https://opentelemetry.io/blog/2026/dart-flutter-opentelemetry/, retrieved 2026-10-10)
[verified]. The apps therefore send no spans, only fixed metrics via the server
(signals.md 4.6a;
ADR 0057). They set
traceparenton every request; the server links it as a span link, so that app error reports and server traces are connected in a way that makes them findable. - The server decides the trace ID and sampling (
telemetry.traces.trust_remote_parentis off by default). Reason: a client must neither force everything to be recorded nor choose thecorrelation_idthat is in the audit. - An app sends crash reports only if the publisher of the app has configured a target (Sentry, backends.md). Reports contain no content; the app removes message texts, inputs and URLs with parameters before sending (chapter 15).
10. Tests that hold these rules
- Canary test: content with a secret word through API, adapter and collector; the word must not appear in any export (gate).
- Allowlist check: every attribute key in the code is in the catalogue, every key of the collector allowlist is in the catalogue.
- Cardinality test: metric attributes only from finite sets; no IDs on metrics.
- Name test: every metric used in dashboards, rules and SLOs is in the catalogue.
make ops-check:otelcol-contrib validatefor base, overlays and pairs (checkcollector),promtool check config,check rulesandtest rules(checksprometheus-config,prometheus-rules,prometheus-rule-tests),amtool check-configwith routing (checkalertmanager), Loki, Tempo and OpenTofu (checksloki,tempo,tofu); alert thresholds equal to their configuration values (checkalert-thresholds). Grafana provisioning in the portability test.make ops-check, checksslo-docsandsloth: targets and thresholds in slos.md equal to the Sloth files; generated rules equal to a fresh generation.- SLI boundary check: the generated boundaries of the own measurement equal to a fresh generation
from the Sloth files; every SLO has a
sli.*metric instats_minutes(25, VZ-T02, VZ-T03).
11. Configuration values of this chapter
| Name | Default | Meaning |
|---|---|---|
telemetry.enabled |
true |
telemetry on or off |
telemetry.traces.sampler_ratio |
1.0 |
share of the traces that the SDK records; the collector then samples again |
telemetry.traces.trust_remote_parent |
false |
true: an incoming traceparent becomes the parent context (its trace ID becomes correlation_id, its sampling flag applies); false: span link only, own trace |
telemetry.logs.exporter |
both |
otlp, stdout or both |
telemetry.logs.level |
info |
lowest level that is written |
telemetry.pseudonym_key_ref |
file:<secrets.dir>/telemetry_pseudonym_key |
key for HMAC pseudonyms; at least otel.MinKeyBytes bytes |
telemetry.dashboard_url |
empty | link from the admin console to the telemetry backend |
stats.cache_ttl |
5m |
how long a computed statistics result stays valid |
stats.cache_max_entries |
1000 |
statistics results cached per api process; above it the least recently used one is evicted, because arbitrary ranges give unbounded distinct keys |
stats.max_range |
400d |
largest queryable time range |
stats.time_zone |
UTC |
IANA time zone of the day boundaries in statistics, daily aggregates and timeline (admin-statistics.md, section 5) |
12. Decisions of this chapter
| No. | Decision | Reason |
|---|---|---|
| R-OB-01 | Fan-out in the collector via forward connectors; every backend is an overlay with its own pipelines. | Several backends without list conflicts when merging; without an overlay, the base stays valid. |
| R-OB-02 | Privacy twice: prohibition at the source and allowlist in the collector, checked with a canary test. | An error in the code alone must not leak content to the outside. |
| R-OB-03 | People only as an HMAC pseudonym in spans and logs, never on metrics. | Debugging stays possible, performance monitoring of individual people does not. |
| R-OB-04 | Tail sampling in the collector: all errors, all slow ones, a share of the rest; the SDK records everything. | Errors are never lost through random sampling. |
| R-OB-05 | The server decides the trace ID and sampling, not the client; an incoming traceparent is only a span link by default. |
A client cannot force full recording and cannot choose the correlation_id in the audit. |
| R-OB-06 | Histograms with fixed boundaries; every SLO threshold is a boundary. | An SLI from buckets is exact only at boundaries. |
| R-OB-07 | correlation_id is the trace ID of the triggering request. |
Events, audit and traces can be connected without a second ID. |
| R-OB-08 | Status page and statistics do not depend on the observability stack. | The stack is optional; operational functions of the app are not. |
| R-OB-09 | Runtime texts in ops artifacts (alert texts, dashboard titles) are English. | Instance operators worldwide; all repository content is English (D-W-94). |
| R-OB-10 | The apps measure SLIs themselves (own measurement in stats_minutes) with boundaries from the Sloth files; Prometheus stays the source for alerts. |
R-OB-08 forbids reading from the telemetry; one source for boundaries keeps both paths comparable (ruling T7, 25-visualization.md). |